Canadian home prices post month-over-month gains, while western Canada sees year-over-year losses
June 20, 2019
Erik Fertsman
Overall, Canadian home prices hold bullish uptrend intact with prices consolidating at 2017-2018 levels. The market needs some kind of catalyst to provoke further upward movement or a sharp reversal to the downside.
Yesterday Teranet and the National Bank of Canada (not to be confused with the Bank of Canada, the central bank) released their latest findings on the Canadian housing market. The data is collected using an effective methodology of comparing prices on the same homes. So rather than aggregating all homes in cities across Canada, or simply calculating the mean of all home prices year-over-year, month-over-month, the Teranet-National Bank House Price Index focuses on the change in price of the same unit. This is a way more effective method to extract prices, since not all homes, even if they cost the same, are comparable in each city and across different provincial markets.
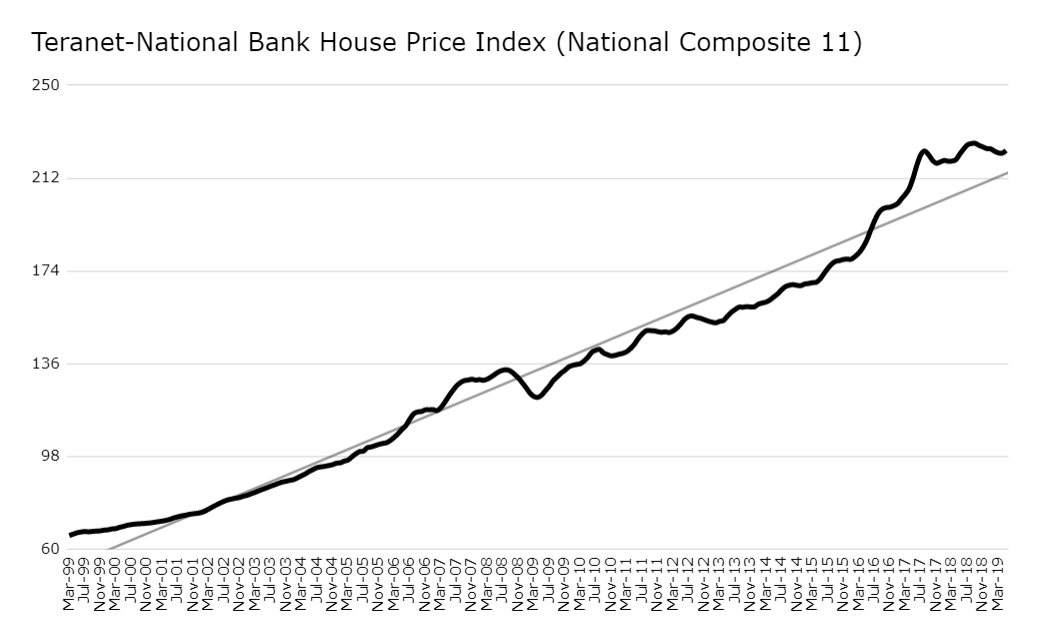

As we can see above, the national data has a history of soaring since the C11 index began. But the most rapid period of expansion was from the 2008 financial crisis all the way to the summer of 2017, after which prices began to consolidate. While prices collapsed in the US in 2008, they merely slipped in Canada. Now they have more than doubled since 2005, and the national index is holding above a key support level of 222. This is a far cry from wage growth, but that's a story to be covered in another post.
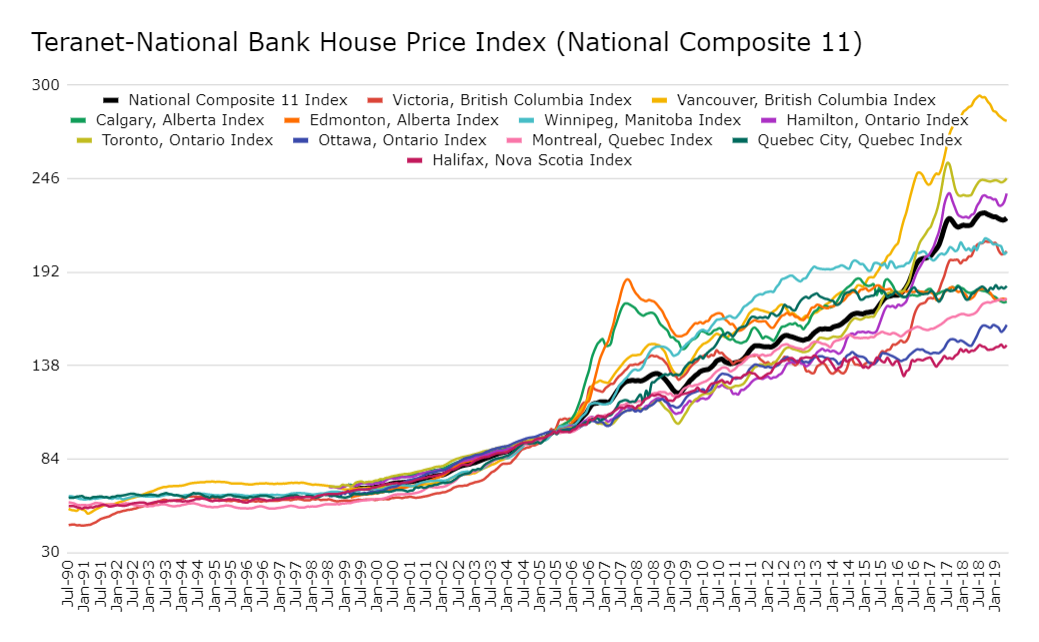
Canada is a huge country, and similarly to any economy with a vast land mass, prices at more disaggregated levels vary widely. The most expensive prices are found on Canada's west coast city of Vancouver where the index hit near 300 last year, while the least expensive prices can be found on Canada's east coast city of Halifax- where the index reached 150. I say most and least expensive because all markets are pricing-out participants in their respective local economies. Halifax, for example, continues to benefit from first-time home buyer incentives, historically-low interest rates, and happens to be located within the province of Nova Scotia, which holds one of Canada's highest public employees-per-capita- and folks there are still
struggling to enter that market.
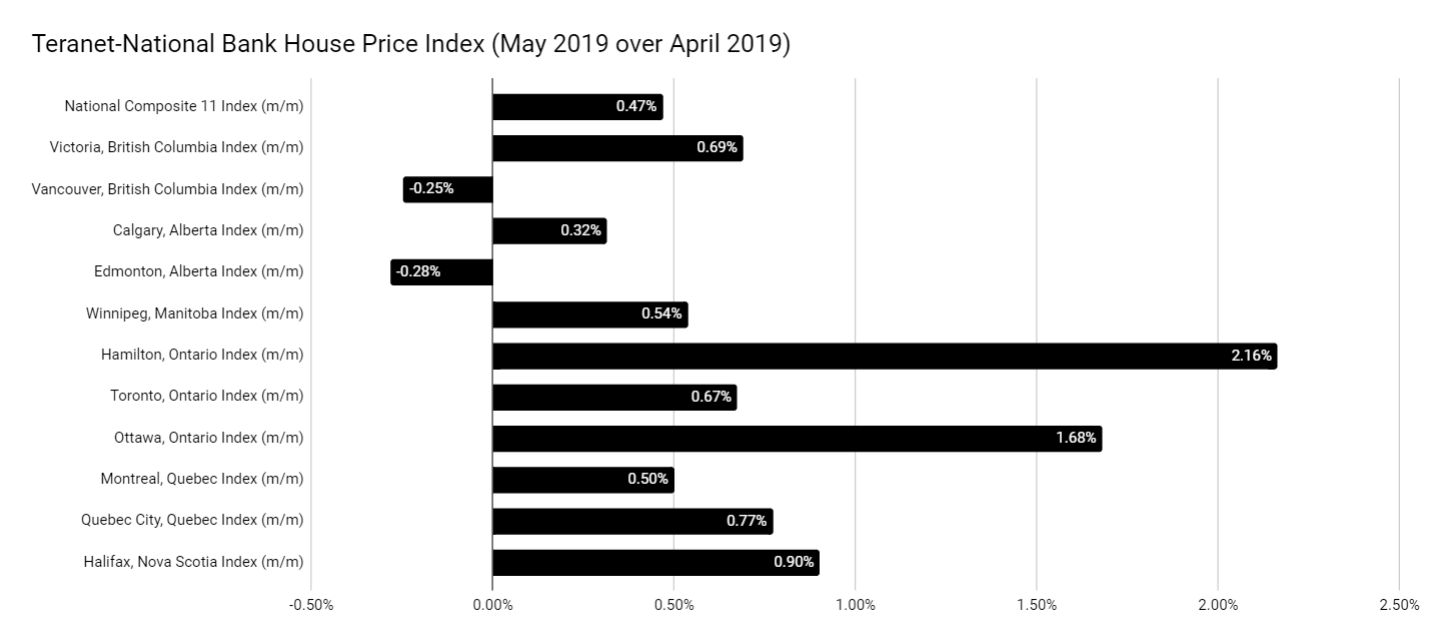
When you look at the month-over-month data ranging from April to May of this year, overall, you don't see any signs of a housing retreat. In fact you have strong above-inflation growth of 2.16 percent in Hamilton, Ontario, with the nation's capital not far behind at 1.68 percent. Even Halifax posted a greater percentage increase than Toronto and Vancouver- the hottest markets. Bottom line, national prices rose 0.47 percent (that's over 5 percent annually!).
Of course, housing prices are quite seasonal, so focusing on month-over-month prices should be drawn to a minimum.
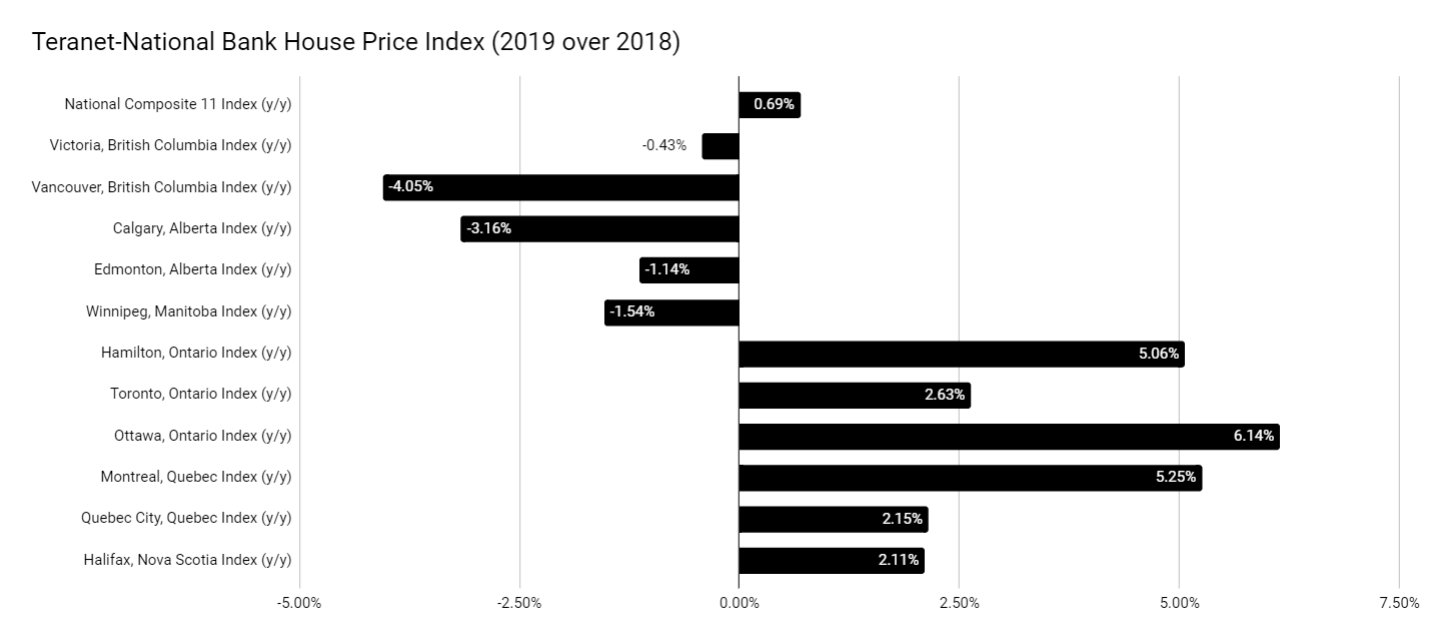
Year-over-year price changes are even more interesting. The national index now sits 0.69 percent higher in May 2019 than it did in May 2018. Meanwhile, we see a sharp divide between eastern and western Canada.
East of Toronto, markets have posted ambitious gains between 2.11 and 6.14 percent, with Ottawa taking the lead and Halifax trailing behind. West of Toronto, we have losses ranging from -0.43 percent in Victoria to -4.05 percent in Vancouver. These two different regional trends are likely a mixture of government response to house price inflation and economic factors, such as the oil crisis out west.
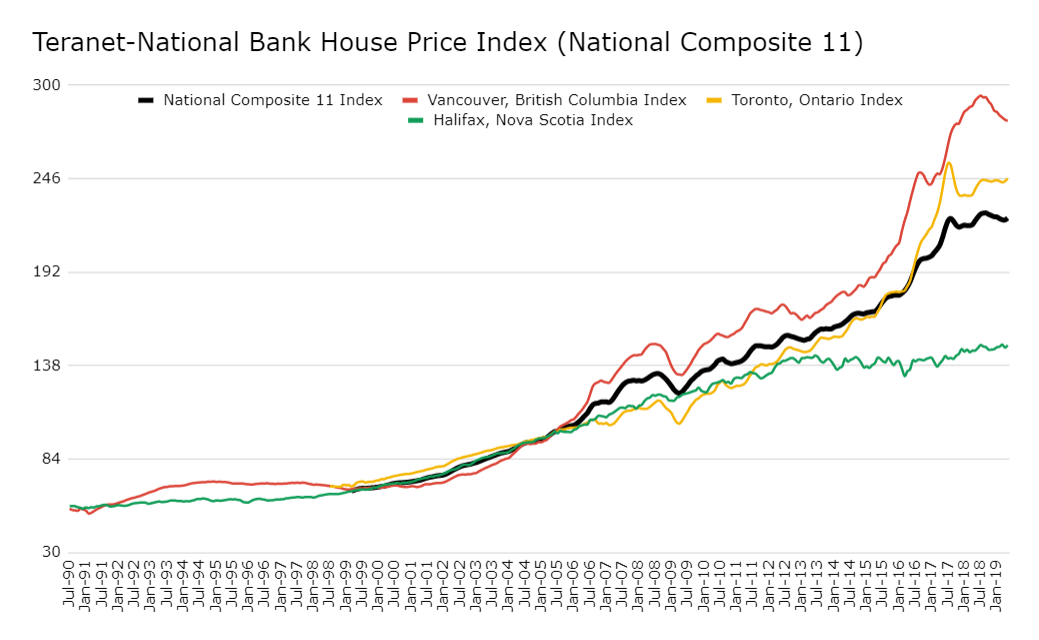
It's worth pausing to take a look at the gap between the most and least expensive markets across the nation: it's breathtaking. Prices went absolutely parabolic in Ontario and British Columbia, while Nova Scotia looks like it's been a sitting duck, almost like no one wants to mash credit and savings into that market.
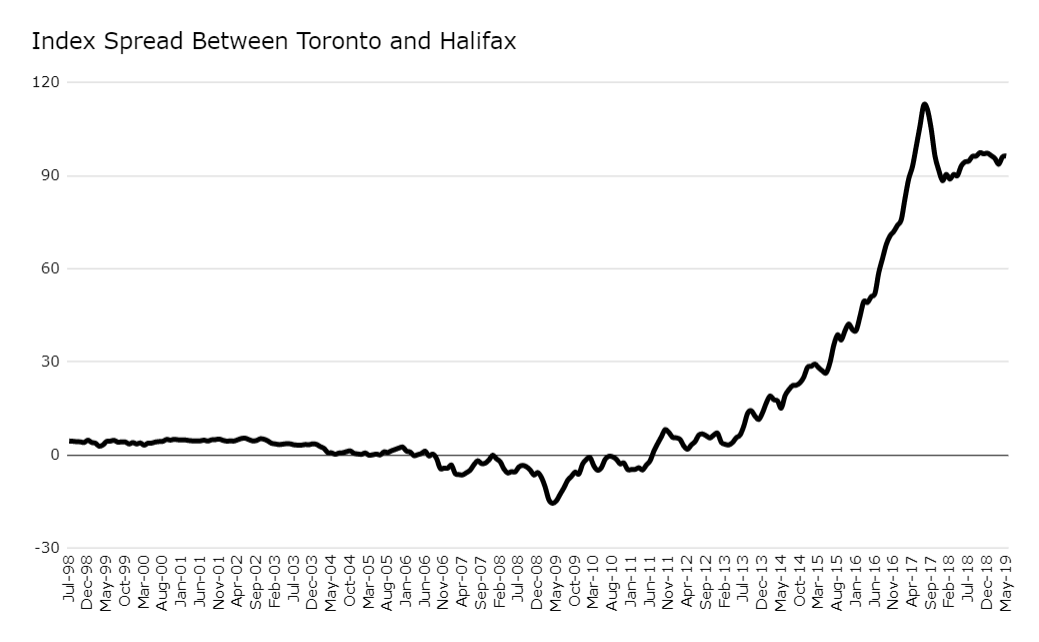
The disparity can be visualized another way. Check out the spread between Toronto (the second most expensive market in Canada) and Halifax. Halifax was gaining faster than Toronto prior to mid-year 2011. And this makes sense: Halifax has a much smaller economic mass, and so, much less credit needs to be allocated to move prices there. But after 2011, Toronto blew Halifax out of the water.
Notwithstanding, and technically speaking, that parabolic trend now looks violated. Two scenarios are now on the table: either Halifax will begin to increasingly gain ground on Toronto (if Toronto continues to under-perform or fall), or the latter will simply continue to scream on higher.
One thing is for sure, the Canadian housing market is ludicrous and expensive by epic proportions, and we are only looking at 20 years of data!
And if the index starts falling below 222 in the national index, then I'll start to look for downside.
SHARE THIS ARTICLE
Enjoyed this article and want to support our work, but are using an ad blocker? Consider disabling your ad blocker for this website and/or tip a few satoshi to the address below. Your support is greatly appreciated.
BTC Address: 13XtSgQmU633rJsN1gtMBkvDFLCEBnimJX