Canadian cities post fresh aggregated home price record in July, but at slowest pace in 10 years
August 20, 2019
Erik Fertsman
This morning Teranet and the National Bank of Canada (TNBC) released their home price index data for the month of July, and the results were spectacular. Canadian cities, on aggregate, managed to break the previous all-time high and are now posting a fresh record on the index. The summer sales season is in full swing, and everyone was expecting nothing short of an aggressive performance.
There's just one problem: the record high comes in at a time when prices are moving at their slowest pace in 10 years. What's more, the data is at odds with Statistics Canada's national home price index, which posted a contraction two weeks ago for the first time since 2009. So, what the heck is going on? And, what is the TNBC data telling us that the Stats Can index isn't?
Article continues below.
TNBC index posts fresh highs, but with some caveats
The TNBC data set is a particularly special one, because, unlike other indexes, it measures the price change of the exact same home over time in designated Canadian cities. Not all homes are equal, so getting the measurements right is particularly important when you have a real estate market that is diverse and quite often non-comparable.
So, what did TNBC find? Here's the data:
The teal blue line is the TNBC's index value, and the grey columns are the percentage change from previous year, which I've calculated for you. I've also added the percentage change in national mortgage credit from the previous year (orange line).
Let's start with the index. Canadian cities, on aggregate, managed to break the previous all-time high of 226 and are now posting a fresh record of 227 on the index. I said, previously, that the index really needed to break the previous all-time high during this summer's sale season in order to show strength. Otherwise, folks would start fretting about weakness and a housing crash. We're past it, so pop the champagne and start thinking about loading up on an investment property!
Before you do that, though, take a look at the orange line on the chart above. The reason I've included this data is because we know there's a strong relationship between home prices and the quantity of mortgages
issued by commercial banks, not interest rates. As you can see, mortgage credit growth has been trending downward since early 2018. Only in the last couple months did we begin to see a bounce in total mortgage credit quantities. But, that's just it, it's merely a bounce at the moment.
One of the problems we're now facing is, that we are not sure if mortgage credit growth will bounce back to previous levels. If it doesn't, there's very little supporting home price growth. Therein lies the rub. And with anemic wage growth
and strong economic headwinds constantly blowing in our faces now, getting involved in the Canadian real estate market seems like a very risky move. Will the index stay above the previous all-time high?
Another thing to point out, is this evident pattern on the TNBC home price index:
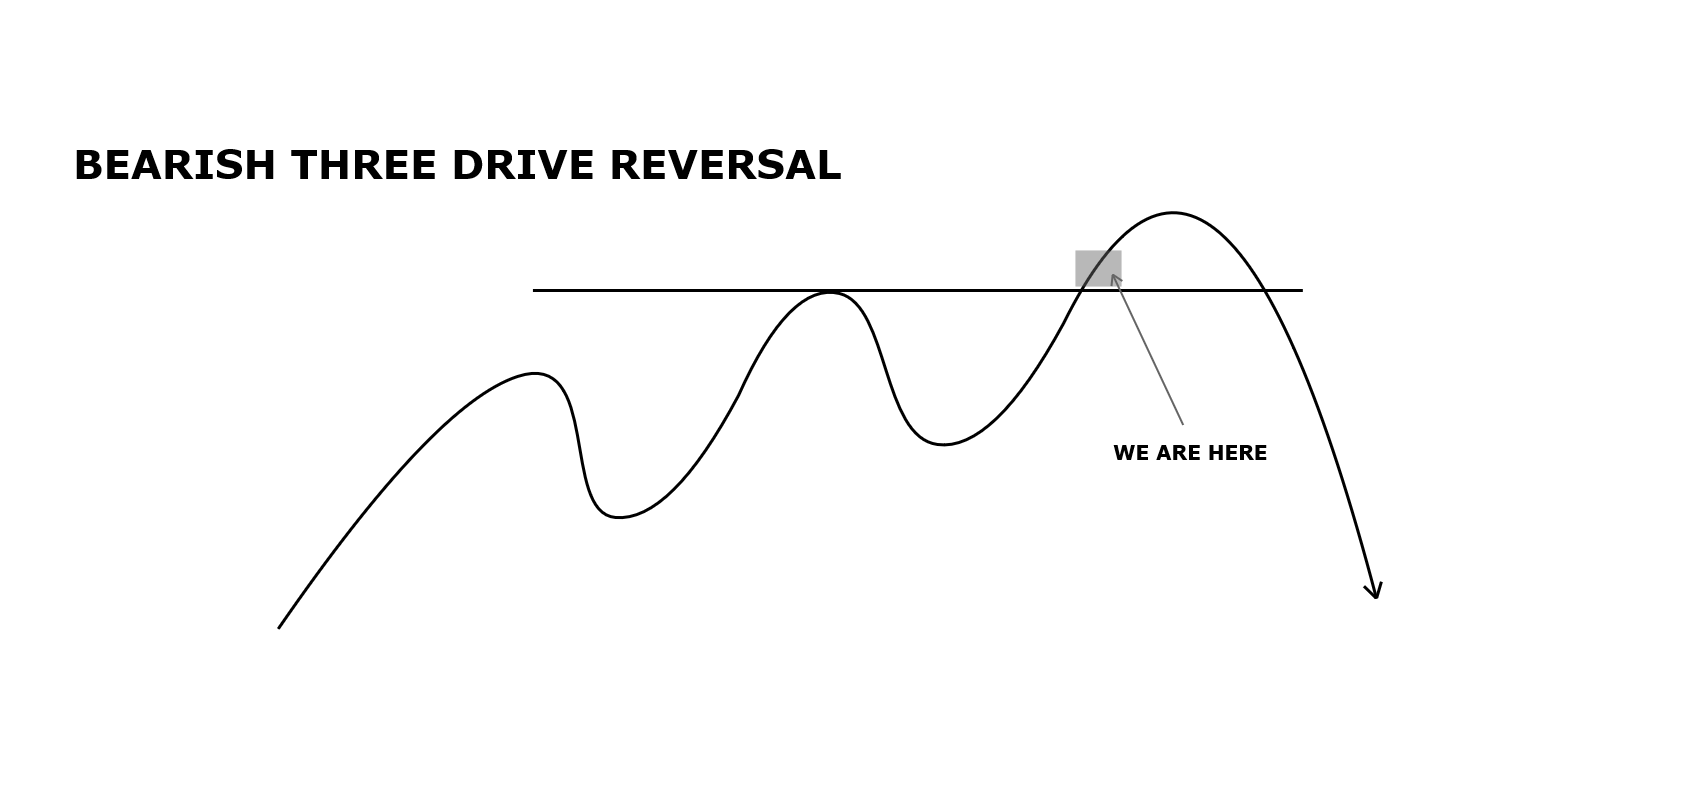
This bearish "three-drive" pattern often plays out as a reversal. This is common knowledge within trading circles. It's clearly painted on that teal blue line on the chart above in the TNBC data.
Also, the TNBC record high comes in at a time when prices are moving at their slowest pace in 10 years. Check it out:
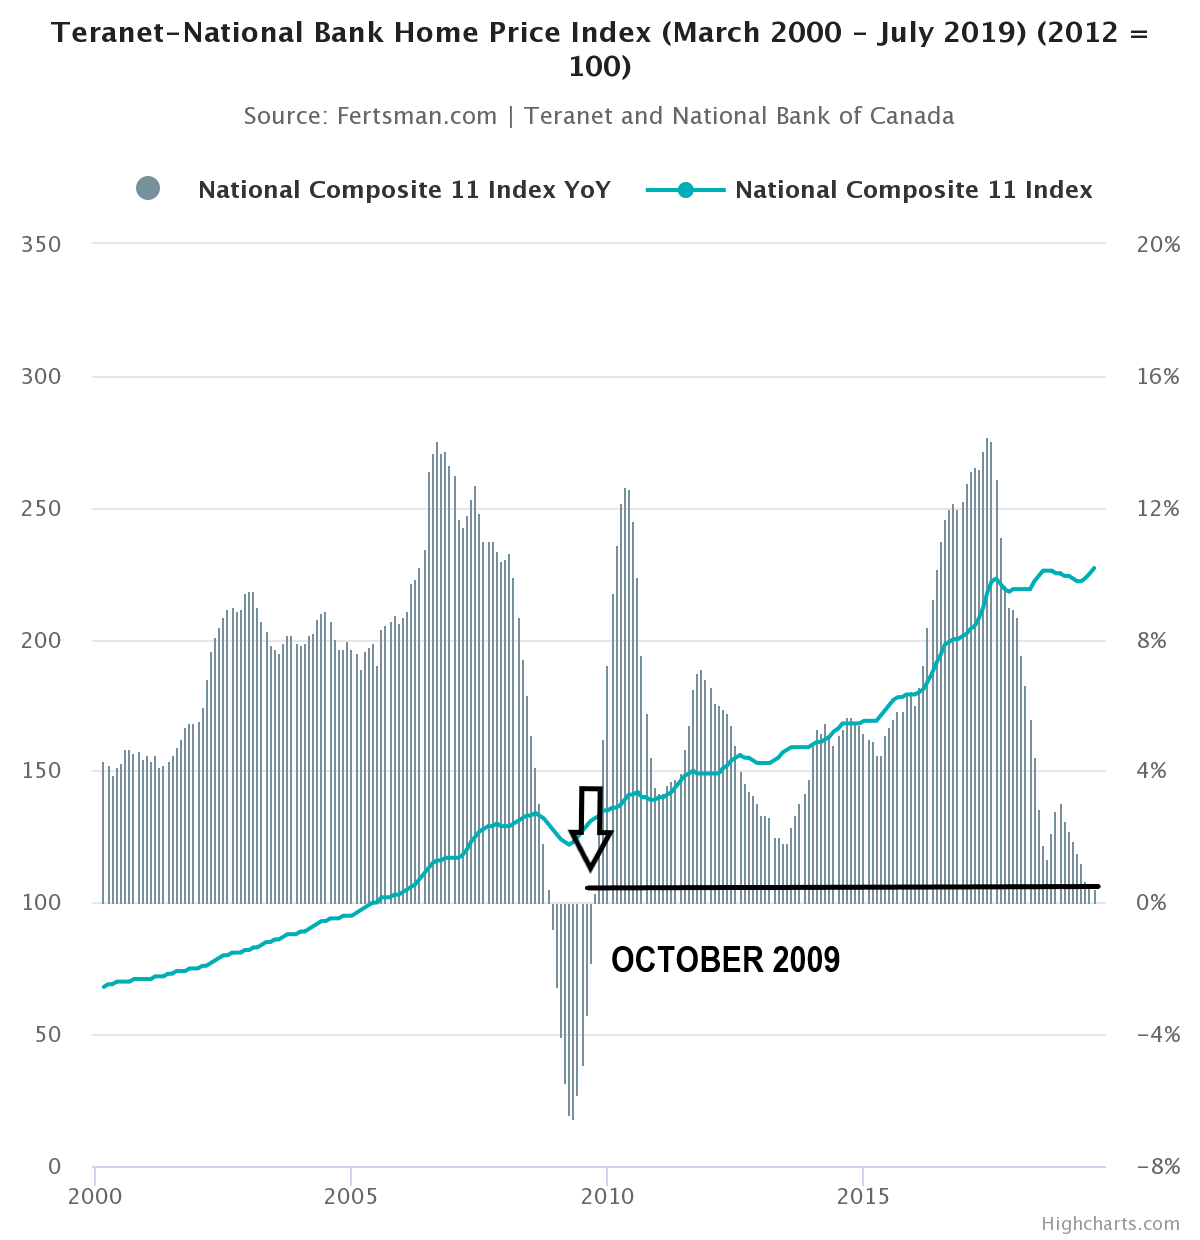
July posted a percentage increase of 0.44 percent, which is tiny (you can see the latest version of this chart above in interactive form by clicking on the EMP Data Series button). Looking at the grey columns, you can see the peaks and troughs created by the home price index. If 2007-2008 is any indication, high peaks often leads to deep troughs which are further price corrections. We have yet to see a strong bounce or dip where prices show considerable year-over-year strength or weakness. In all likelihood, we could be midway through the price increase deceleration, with a price decrease acceleration not off the table quite yet.
So, overall, the low mortgage credit growth, the bearish reversal pattern, and the slow pace of price change reveals that weakness is apparent.
Article continues below.
Here's what's unfolding across Canada
There's only so much we can do with the national index. After all, using aggregated data is not the most effective way of understanding what's really going on.
Here's what's happening in Vancouver, Toronto, and Halifax:
What we see is something closer to what the Stats Can data has been showing us at the regional and provincial levels, particularly Eastern Canada
and Atlantic Canada (I've been waiting a tad to cover Western Canada).
Halifax posted a year-over-year increase of 3 percent, which is consistent with the upswing we saw in the Stats Can data. However, Halifax is the cleanest dirty shirt in Atlantic Canada. If you recall, Newfoundland and New Brunswick have now been long posting falling home prices. Once the summer's sales season is over, Halifax could lose this positive momentum and join the negative regional trends.
Meanwhile, Toronto has yet to break above that 3.72 percent growth rate on the TNBC index. This is also consistent with the sideways action we saw in the Stats Can data. If you recall yesterday's article, we're anticipating Q2 2019 provincial credit data to have a closer look. But, given the anemic growth posted in the Stats Can data already, we assume that mortgage credit hasn't climbed enough to boost home prices. Ontario, including Toronto, are in limbo, if anything.
More importantly, perhaps, is the trend we see in Vancouver: the city posted a negative
6.23 percent change in home prices! This can now be considered a serious price correction, and it might pull down the index once the summer is over, since there's no relief in sight for British Columbia.
Here's what all the cities in the TNBC index are doing on a year-over-year basis:
Things are pretty much the same as the last time I reported on TNBC data. Western Canada is really struggling, with home prices moving deeper into contraction. And, right now, we're at the peak of the sales season, so there's quite a bit of downhill up ahead in a few months time. Meanwhile, these 5+ percentage changes on an annual basis in Montreal, Ottawa, and Hamilton are simply unsustainable, given the pace of credit growth and average weekly earnings.
Brace yourselves, as the Canadian real estate market is now completely out of wack. All it will take for the national home price index to snap back below the previous all-time high is a catalyst. And that catalyst could be the end of the summer sales cycle. If that happens, all bets are off, and folks will be pointing out weakness and screaming housing market crash.
Cover image source: Mark Harrison
SHARE THIS ARTICLE
Enjoyed this article and want to support our work, but are using an ad blocker? Consider disabling your ad blocker for this website and/or tip a few satoshi to the address below. Your support is greatly appreciated.
BTC Address: 13XtSgQmU633rJsN1gtMBkvDFLCEBnimJX